Metricbeat cluster self-monitoring
When you have just installed Elasticsearch and Kibana, if you open the monitoring page you will probably see this screen:
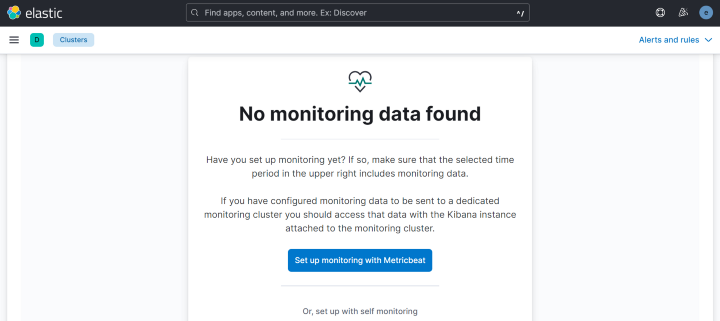
Setup Overview
Kibana informs us that we have not yet configured monitoring on our cluster. This is what we are going to do today by following these steps:
- Install Metricbeat on the system to be monitored
- Send the metrics to Elasticsearch
- View these metrics on Kibana
Installing Metricbeat
I will try to keep this post short and straight to the point. There is a lot more to this rich tool explained in the documentation.
Switch to superuser
sudo suUpdate applications installed on a system
dnf updateNow we will start installing Logstash from a package repository. Run the following command to install the public signing key:
rpm --import https://packages.elastic.co/GPG-KEY-elasticsearchCreate (if it does not exist) the following .repo file and add the content below:
vim /etc/yum.repos.d/elastic.repoand paste the following then save the file:
[elastic-8.x]
name=Elastic repository for 8.x packages
baseurl=https://artifacts.elastic.co/packages/8.x/yum
gpgcheck=1
gpgkey=https://artifacts.elastic.co/GPG-KEY-elasticsearch
enabled=1
autorefresh=1
type=rpm-mdThe repository is ready to be installed:
dnf install metricbeatConfigure Metricbeat to start automatically during boot, run:
systemctl enable metricbeatIf your system does not use systemd then run:
chkconfig --add metricbeatConfiguring Metricbeat
This will configure without a secure communication protocol. We shall set up security ssl on a later post.
Open the configuration file /etc/metricbeat/metricbeat.yml. We shall
define a few parameters. Go to output section and add this configuration to connect Elasticsearch.
output.elasticsearch:
hosts: ["localhost:9200"]
protocol: "https"
username: "elastic"
password: "${ES_PWD}"
ssl.verification_mode: noneTo configure Logstash, we need to create a new .conf file in the following directory:
Replace these values with those of your environment. It is not advisable to fill in sensitive information here, instead you should store sensitive values in the secrets keystore.
metricbeat keystore create
metricbeat keystore add ES_PWDMetricbeat comes with a set of utilities to check if configuration or connectivity is in place. Run the following commands, one after the other to test your configuration and output.
metricbeat test config
metricbeat test outputNext, let’s enable and configure the Elasticsearch x-pack module in Metricbeat. Run the following command:
metricbeat modules enable elasticsearch-xpackYou should have as return: Enabled elasticsearch-xpack.
Since security is enabled, additional configurations are required. So let’s open the file: modules.d/elasticsearch-xpack.yml and add this information:
- module: elasticsearch
  xpack.enabled: true
period: 10sRestart metricbeat and you shall start seeing your metrics on the dashboard
systemctl restart metricbeat